How To Use The Traffic Log
Using the Traffic Log you can monitor the traffic logs of your FSI server(s) and/or traffic server(s).
This site explains the usage of the tool.
Overview
The traffic log provides 3 types of statistical data for each item.
For connectors and folders, the numbers represent the total for all subfolders and items.
- Hits: the total number of items served
- Resource Hits: the total number of individual resources served
(Example: if “example.tif” has been served 10 times, hits would be 10 and resource hits 1) - Traffic: the total traffic served from this folder or asset
(the basis is 1.000, e.g. 1 kB = 1.000 byte)
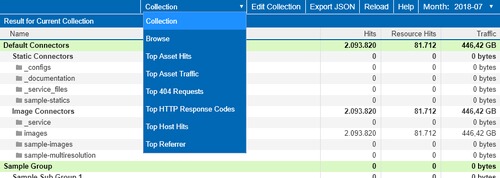
Control Elements – Dropdown Menu
- Collection: display the traffic, hits and unique recource hits for the folders defined by your collection
- Browse: browse through the FSI Server connectors and folder structure to get the stats for each folder and asset
- Top Asset Hits: shows a list of the most frequently requested assets
- Top Asset Traffic: ranks the assets which generated the most traffic
- Top 404 Requests: shows a list of the top requests which returned an HTTP 404 – Not Found response
- Top HTTP Response Codes: shows a sorted list of the HTTP response codes by hits
- Top Host Hits: ranks the hosts from which the assets are served
- Top Referrer: shows the top domains from which the assets are requested
Other Control Elements
- Edit Collection: edit the JSON file used to create your collection
- Export JSON: exports the statistic currently displayed as JSON
- Reload: clears the cache and reloads the data
- Help: opens this help document
- Month: with this selector you can choose which month you want to check
Browse
This section lets you browse through all connectors, folders and assets that have been served in the selected period of time.
Please note that this is similar to the content on your FSI Server, but items not served at all will be missing here.
The blue bar at the bottom shows the grand total of the current view:
The number of Items shown and the summary of hits, resource hits and traffic which have occured for all these items.
You can sort the items by each of the four columns by clicking the corresponding column header.

If you click on a connector, you can browse deeper into the structure.
If you are at file level, the hits and traffic for each file is shown – the resource hits field is empty since by nature there is only one resource causing the hits shown.
The grand total in the blue bar at the bottom changes according to the folder currently displayed.
You can go back to the upper levels by clicking the corresponding path name or return to all connectors by clicking on the All Connectors field.
In addition you can use the history back button (in the tool bar or on your mouse) to go back to the previous location.
In case a folder contains more than 10.000 items, only the top 10.000 items and a note will be displayed.
The grand total at the bottom nevertheless displays the total for all items without any limit.

Collection
Collections make it easy to create a report for groups of folders.
For example, if you have different customers to monitor the traffic for, you can group all relevant connectors or folders in a section and easily see the amount of traffic that belongs to each customer.
Clicking on a connector or folder listed in a group automatically brings you back to the “Browse” view.

Edit Collection
Clicking the button opens an editor where you can edit your collection in JSON format.
You can see an example of such a file on the right.
First you declare the name of a group, afterwards, under “paths”, the FSI Server paths that should be added to the group need to be listed as an array.
You can add source connectors, but you can also add folders on a deeper level, like “catalogs/customer-b/”.
Please note: in order to display the correct amount, avoid duplications in a group. For example, adding “catalogs” and “catalogs/customer-b/” to the same group would lead to a false calculation, since the folder catalogs/customer-b/would be added twice to the calculation.
You can optionally add sub-groups to each group befor you add the paths.
The Indent Icon formats the JSON data, while the Line Icon removes all white spaces. The Wrench Icon fixes the JSON data by fixing quotes and escape characters and removing comments.
With the selector Code/Tree you can switch the appearance of the editor between normal code editor view and a tree view.
Click Save to saves your changes to the collection and display the result immediately.
Please note that the JSON source for the collection is the same for each period of time.

Edit Filter (Does not apply to third-party customers)
With “Edit Filter” you can filter the traffic log results and restrict them to certain paths. This is helpful if you want to give an external customer access to their log data or if you want to search for the results of a certain connector or folder (e.g. to see the top 404 requests of a specific folder).
The filter is a postive list, that means that in the JSON everything needs to be listed that you want to include within an array.
Example: “includes”: “all” shows everything, a filter could look like this: “includes”: [ “connector-a”, “connector-b/folder-a”, “connector-c/folder-a/imagexy.jpg”]
Please note: positions in the array need to be listed without any slashes at the beginning or end of the position.

Export JSON Data
Click the “Export JSON” button to display the data current displayed in the list in JSON format.
This way you can use the traffic data in 3rd party applications.
